“I hear people who think that we can decree today that there be no corruption, and then there will be no corruption tomorrow; it doesn’t work like that.” – Amama Mbabazi
This unscripted remark caught my attention when Ugandan Prime Minister Amama Mbabazi recently spoke at length about the country’s anti-corruption ordinances and the supposed strengthening of oversight agencies. Entrenched public sector corruption has cost Uganda $350 million annually over the past decade. This loss is equivalent to 6% of the country’s entire budget or 75% of its health sector allocations. It’s clear that well-intentioned "decrees" are failing due to poor implementation.
Better strategies are needed to equip stakeholders with the tools they need to demand accountability and effective public stewardship. This summer, I’m working as an AidData Summer Fellow to support Transparency International Uganda’s (TIU) Action for Transparency program in Uganda to help fill this gap. While anti-corruption advocates have long aimed to improve access to high-quality government budget data, a top-down information exchange is not enough to deter corruption. An effective monitoring program requires an open, productive interaction between civil society and those able to "ground-truth" information and provide context. The Action for Transparency program is seeking ways to complete this feedback loop.
TIU uses an online dashboard and a mobile phone application to publish financial and geographic information on government-supported primary schools and health centers, such as the number of teachers and health workers. This initiative takes one step further by providing a whistle-blowing function, mobilizing over 2,000 TI-trained journalists and human rights activists, as well the 5.8 million citizens in the relevant communities to call attention to any locations for which data appearsto be inaccurate or suspicious.
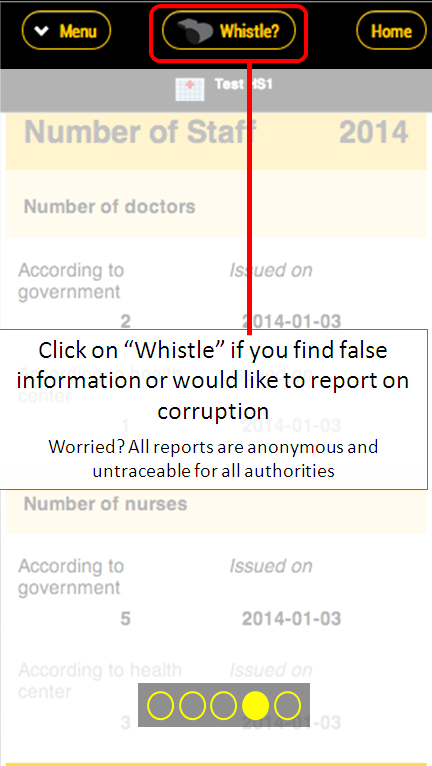
Action for Transparency Dashboard Introduction Screenshot
Action for Transparency has already compiled complete information for capital districts in Uganda and Zambia, but the hope is that this effort can be scaled and give citizens and civil society the information they need to pressure policy makers to tackle irregularities head-on. With approximately one-fifth of primary school teachers and half of all state medical professionals absent on any given day in Uganda, the Action for Transparency program is a potent weapon against "soft corruption" and "ghost workers."
Collecting data and producing reports are a start, but communicating results (or lack thereof) of anti-corruption efforts is critical to long-term impact. I’ve previously argued that data visualizations are helpful to making static, complex data actionable and accessible to policymakers, activists, and citizens alike. In Uganda, I conducted a series of trainings with TI-Uganda staff and partners from Forum for Women in Development, Action for Development, and Citizen Watch-IT. Participants in the trainings learned how to use GIS to synthesize diverse data points into approachable maps to further their anti-corruption efforts.
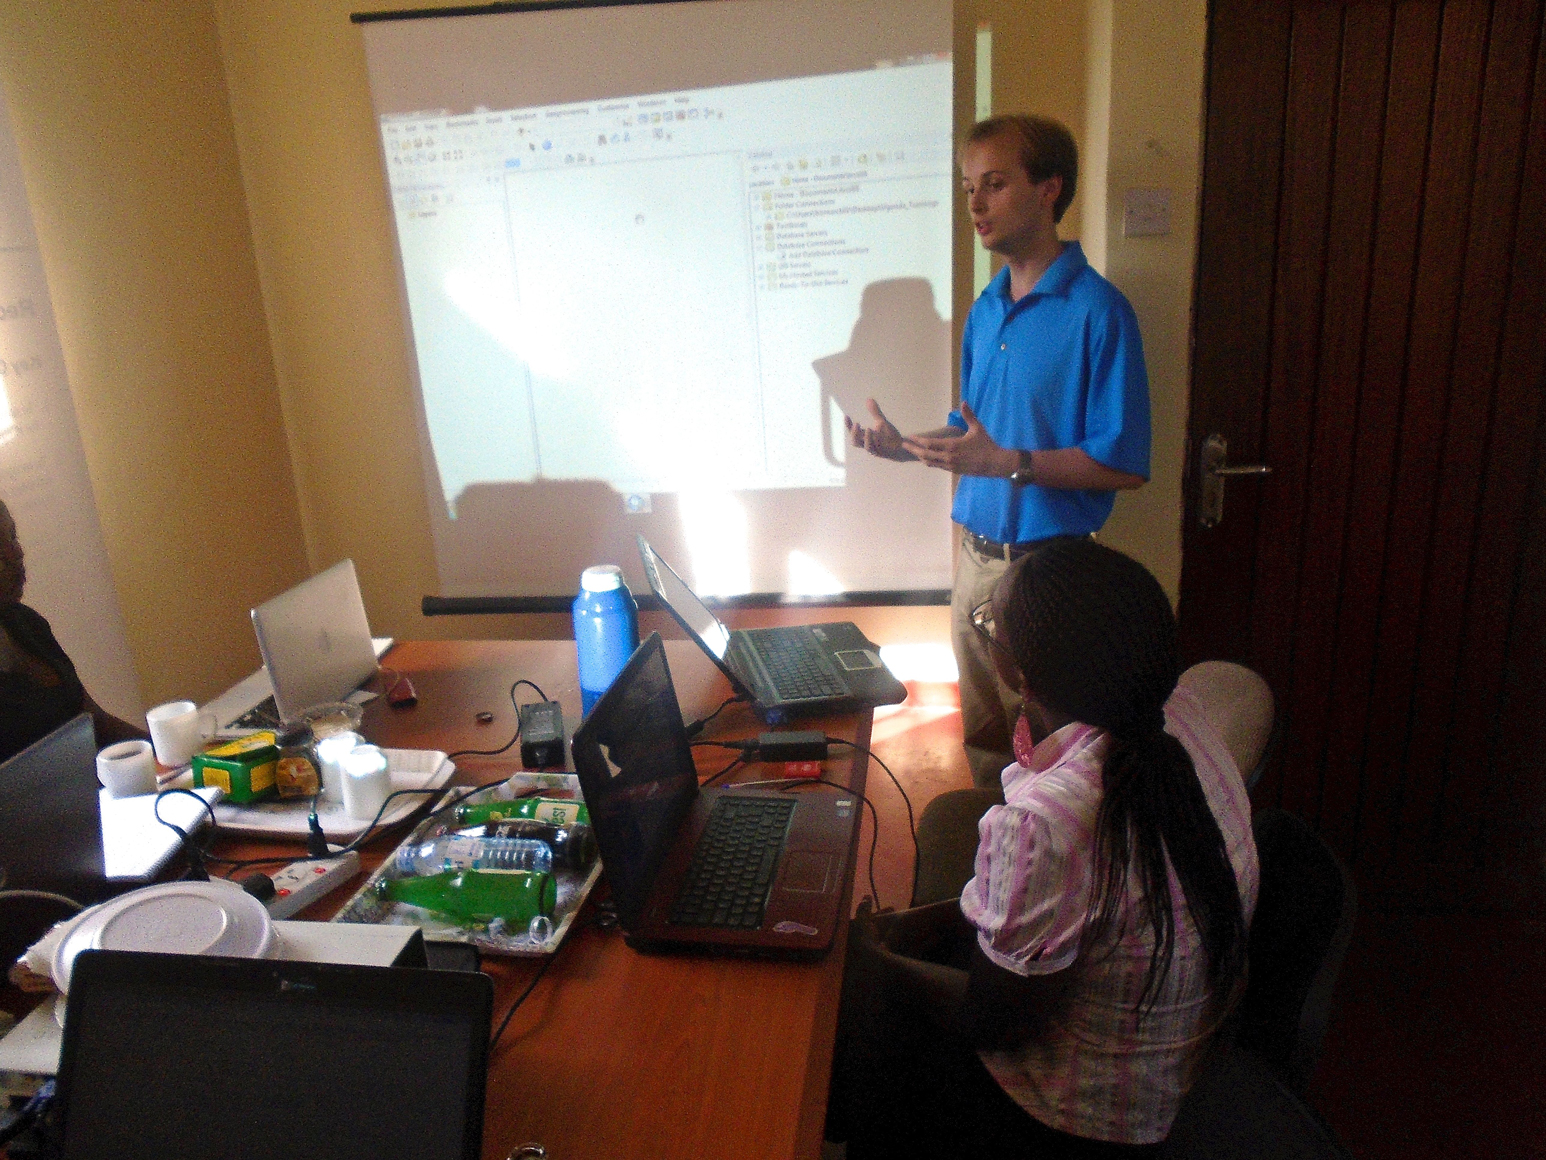
Justin Conducting a TI Training
As Ugandan corruption fighters have greater data visualization skills at their disposal, they can begin to assess whether incidences of corruption or data irregularities appear in certain places systematically. By joining this information with other spatiallyreferenced data, such as geocoded data from Uganda's Aid Management Platform or the Armed Conflict Location a Event Data dataset, staff can begin to examine possible relationships between corruption, foreign aid funding, and violent conflict.
For organizations in Uganda and elsewhere that seek to affect change by shaping public discourse and policy, data visualization tools are invaluable because they enable a broad base of stakeholders, including decision-makers, to interact with key information and ask probing questions with greater ease. Geospatial technologies, in particular, show promise for TI to leverage its crowdsourced corruption data with greater force and advocate for responsible governance more effectively. While we may not be able to "decree today that there will be no corruption," GIS can be another tool in the struggle against it.