In the world of aid and development data, many organizations are striving towards the same goal: to use transparency and open data to make more efficient aid decisions and allocations. There are many suppliers of aid information - from data on aid and budgets to results. But how easy is to compare across these data sources to make meaningful development decisions? How might data suppliers work together to revolutionize development for the better? The Innovations for Peace and Development (IPD) program, located at the University of Texas at Austin, recently completed a deep dive into the world of the World Bank’s BOOST Budget Data and Mapping for Results (M4R) data in an attempt to answer these burning questions.
Launched in 2010, the World Bank’s BOOST initiative encourages governments to publish their budget data on user-friendly platforms. In addition to the budget data, the Bank provides data on project aid allocations through their Mapping for Results initiative (M4R). M4R not only provides a visualization of the locations of the Bank’s activities, but is also a part of a larger movement aimed at providing access to information regarding funding, poverty indicators, sector allocations (e.g., health, agriculture), and most importantly, results. The success of the transparency initiatives is contingent upon the degree of the compatibility and interoperability of their data. Compatible budget and aid data sets allow government expenditures to be easily mapped against project aid, encouraging more efficient allocation of funds and decreasing overlap between government and donor projects.
Our team’s research was two fold. With Kenya as our subject of analysis, we narrowed our scope of comparison to the data sets’ geographic divisions for the country (i.e., administrative division precision codes) and the description of the aid project or budget expenditure for the health and agriculture sectors, which are referred to as activity codes.
Two questions drove our analysis:
1) Are the geographic precision codes in the budget data, which indicate the type of location (city, district, etc.), compatible with the aid project data?
2) Do the activity codes, which indicate the types of activities taking place, in the health and agriculture sectors of Kenya match across data sets?
Let’s tackle precision codes first. For Kenya, the administrative division codes were messy. A new constitution adopted in 2010 drastically changed the country’s administrative divisions. While the BOOST data included these newly mapped divisions, the M4R data sets used pre-2011 divisions. The result? An overlapping web of administration division that makes these two data sets extremely difficult to reconcile.
The following three maps illustrate the different ways that Kenya has been divided. The first map shows the provincial system that was in place prior to the 2010 constitution change:

Figure 1: Provinces, Kenya (pre-2013)
The provincial system was replaced by the county system shown in the second map:
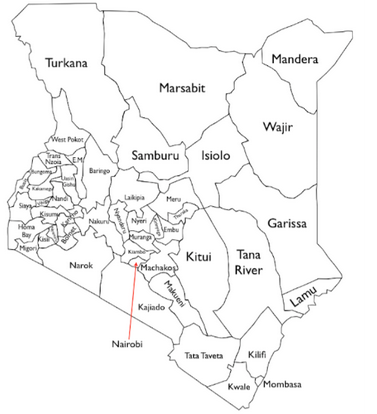
Figure 2: Counties, Kenya (post-2013)
The third map shows the local authorities (municipal, county, and city councils). These, along with electoral constituencies (not shown), are other types of administrative divisions that exist concurrently and do not form part of the county system:

Figure 3: Local Authorities, Kenya
When it came to activity codes, the findings were similarly incongruent. After examining all of the potential options for budget expenditure classification and aid activity codes, we attempted to match each code with a potential partner in the accompanying data set. For most cases, in both health and agriculture, there was no natural partner. The table below shows the pairings of categories for the agriculture sector. Green indicates strong compatibility, yellow is moderately compatible, and red indicates incompatibility.
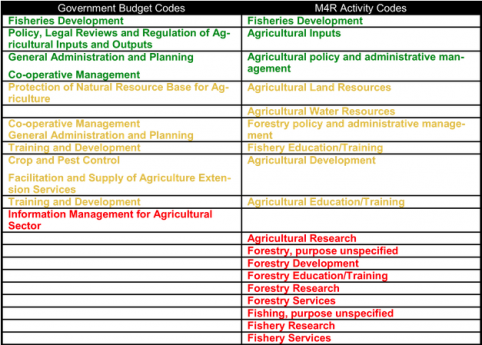
Figure 4: Compatibility of government budget codes and World Bank project activity codes
Our curiosity about whether suppliers of aid information were on the same trajectory planted the seeds for our research. The difficulty, however, is the enormity of the task at hand. As mentioned previously, there are numerous major players in the open data game, and each one has its own system of classifications and categories. Our research only analyzed two data sets provided by one supplier for one country and found limited compatibility. How much more complex will it become if we add more data suppliers, countries and datasets to the equation?
One very real concern is that, as we compare different countries using different data suppliers, we will run into even greater inconsistency that could make analysis not only difficult, but also misleading. This prediction, of course, is not meant to discount the potential of open data, but rather to provide insight into making this type of data use even more effective.
Data suppliers must think critically about how they are classifying activities, expenditures, and regions. It is important that the World Bank and other donor organizations work closely with their country partners to develop uniform administrative divisions and activity codes. We believe that an established, smaller number of general activity categories will improve the system. In terms of the BOOST initiative, aid classifications and precision codes may need to be tailored to each country based on national budget expenditures.
As our analytical gears continue turning here on our Open Aid team, we posit this question - how can we improve compatibility and comparability among data sets to make the most of open data initiatives?