Conventional wisdom tells us that seeing subnational aid and development data on a map should help decision makers more effectively allocate their investments to best reach those most in need. But we shouldn’t rely solely on conventional wisdom to guide our choices. AidData considers geospatial information a vitally important tool and we need to know whether maps really do produce better aid targeting.

The left image is a screenshot of the treatment that uses lengthy written information, while the right image was used in the mapping treatment.
A recent pilot study by AidData researchers at the College of William & Mary, Brigham Young University, NYU, and the University of Texas set out to test these assumptions about which tools lead to effective aid allocation. In a randomized lab experiment, we asked 223 study participants to hypothetically allocate funds from an actual pipeline $33 million aid project across the 26 districts in Malawi such that the districts with larger absolute numbers of poor people and lower amounts of previous aid would get more new funding. Study participants were randomly assigned to receive information in different formats on which to base their allocation decisions: (1) a lengthy PDF document with information about the districts in Malawi; (2) the lengthy PDF and a spreadsheet containing district-level aid and poverty data; or (3) the lengthy PDF plus a map showing district-level aid and poverty.
Preliminary results from the study, shown in the figure below, indicate that maps may, in fact, lead to better targeting of aid dollars to reach those most in need.
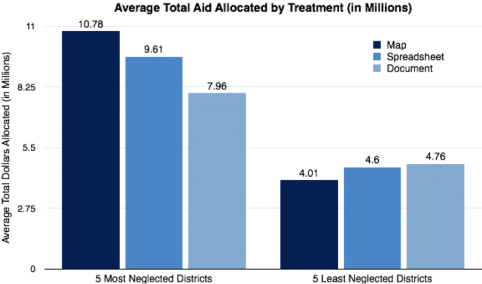
The results show that participants using a map to support their aid allocation decisions completed the given aid allocation task most effectively. In the five most neglected districts (those receiving the fewest previous aid dollars per poor person), individuals given a map allocated on average a total of $10.78 million, compared to $9.61 million from those given the spreadsheet and $7.96 million from those given only the lengthy document. The mean differences in total allocations between those receiving a map versus a document and those receiving a spreadsheet versus a document were highly significant statistically.
In the case of the five least neglected districts (those receiving the most previous aid dollars per poor person), participants using a map also outperformed the others. Because these districts had already received more assistance for their impoverished citizens, they should have received fewer aid dollars. Participants using a map allocated on average the least total funding to these districts ($4.01 million), compared to $4.60 million from those using a spreadsheet and $4.76 million from those using only the PDF document. The mean differences between those using a map versus a document and between those using a map versus a spreadsheet again were statistically significant.
These pilot experimental results represent only a small first step in using rigorous scientific approaches to identify how information and decision support tools affect aid allocation. Follow-up studies will explore questions of how to best represent subnational information to support aid allocation decisions and how biased information may impact these decisions. Very soon we need to take such tests out of the laboratory and do similar rigorous field experiments with policy practitioners who actually make aid allocation decisions.
Check back with us in the coming months for the formal write up of this study and discussion of findings from other AidData research projects.


