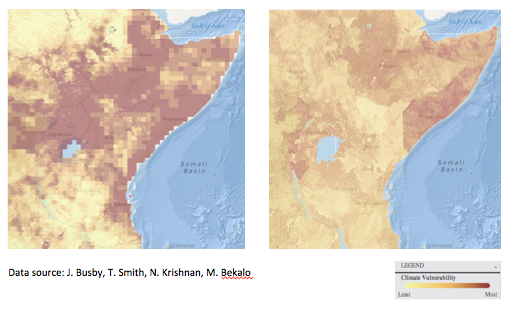
The Robert Strauss Center’s Climate Change and African Political Stability (CCAPS) programand Development Gatewayrecently launched a dashboard enabling users to analyze where and how climate-related events could disrupt Africa's security and development. The climate dashboard is the latest in a series of mapping tools released over the last year and a half. Together, the mapping tools combine extensive development, security, and governance data for policymakers, researchers, and citizens to use in exploring critical questions related to climate change impacts and responses in Africa. Josh Powell recently gave a behind-the-scenes look at the technology and process used to develop the climate dashboard. In this post, I demonstrate how users can use this innovative tool to analyze and forecast climate security risks in Africa in a new, hands-on way. How do climate security risks differ across Africa?The dashboard provides an interactive platform where users can use the CCAPS climate security model to explore how climate, demographic, socioeconomic, and governance factors come together to impact a community’s vulnerability to climate change. For example, looking solely at climate-related hazards (see below left), much of east Africa shows chronic vulnerability to climate risks. Yet, taking climate risks, population pressures, household resilience, and governance capacity all into account (see below right), a more nuanced picture emerges, showing eastern DRC, Burundi, Somalia, and parts of Ethiopia more at risk, by virtue of lower household and governance capacity to respond to those climate risks.
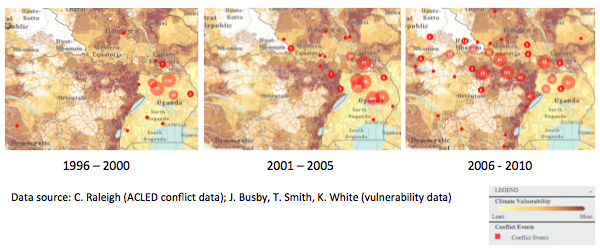
How do protracted conflicts compound climate-related vulnerabilities?Examining CCAPS conflict and climate vulnerability data together on the dashboard shows that conflict events involving the Lord’s Resistance Army (represented in red below) have gradually diffused from Uganda into areas with less stability and greater climate insecurity like South Sudan and northern DRC. Such conflict patterns compound climate security challenges that countries face.
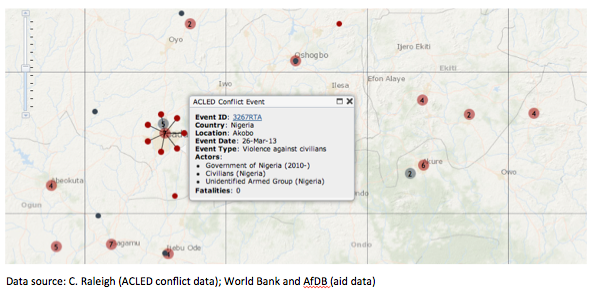
Which emerging conflicts are likely to impact development aid projects?Real-time conflict data collected by our partners at the Armed Conflict Location and Events Dataset, combined on the dashboard with geocoded aid project data from CCAPS-AidData, the World Bank, and the African Development Bank, illuminate the intersection of conflict and development. For example, violence against civilians (in red below) often coincides with aid project locations (in grey). With violence against civilians being an important barrier to development in conflict-affected countries, tracking the locations and actors involved in these events is key.
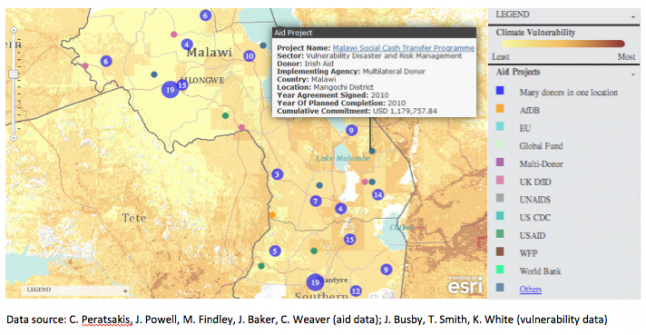
Is aid targeting areas of greatest climate security risks?
Geocoded aid project locations are detailed in the CCAPS dashboard (in varied colors below). Users can then add a layer of climate vulnerability data to assess how aid projects relate to areas of chronic climate security vulnerability.
These are just a few of the questions we’ve been exploring in our research, and we hope the mapping tools spur exploration of countless other questions. For more information, user guides to all the CCAPS dashboards are available here.