A new climate dashboard – released by the Robert S. Strauss Center and Development Gateway – enablesresearchers to more easily explore and analyze climate security risks and insecurities across Africa. The innovative online platform utilizes a model developed by theStrauss Center’s Climate Change and African Political Stability (CCAPS) –the Climate Change Vulnerability Model – that analyzes where and how climate-related events could disrupt Africa’s security and development. Development Gateway also developed an interactive dashboard drawing upon the data used in creating the climate vulnerability model, enabling CCAPS to explain each step of how the model was built.
The CCAPS Climate Dashboard includes an impressive model of vulnerability to climate change across Africa. The model uses 21 continent-wide indicators (many of which are sub-national), grouped into four “baskets” or categories: Climate-Related Hazard Exposure, Governance, Population Density, and Household Resilience. These baskets are evenly weighted to generate the final model.While CCAPS researchers used even weighting of the four baskets, applying different weights could generate significantly different pictures of climate vulnerability throughout Africa. Recognizing the opportunity for impactful, on-the-fly analysis, CCAPS and Development Gateway – an institutional member of the AidData partnership – created a climate dashboard with “geo-processing capability” allowing users to generate their own climate vulnerability indices using the Esri ArcGIS Model Builder and Javascript API. To give you an inside look at the development of this cutting-edge tool, we’ve shared a bit of our process below.
First, we re-created the vulnerability model in ArcMap 10.1 using Model Builder and the Map Algebra tool (Figure 1 below). The top four blue circles in Figure 1 are the basket layers in raster format and the bottom four circles are the weights for each basket. These are fed into the Map Algebra Raster Calculator tool (Figure 2 below), which generates the final composite raster layer using the expression below.
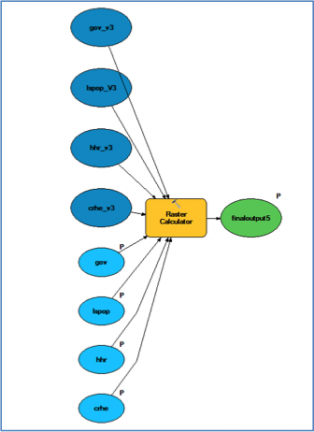
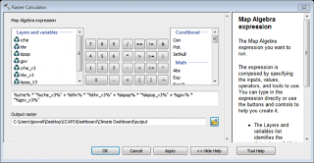
Figure 1 (left). Vulnerability model in Map Builder. Figure 2 (right) Map Algebra tool. After building the model, we published the layers and associated tools as an ArcGISGeoprocessing Service which allows users to: (1) edit the model parameters (e.g., change the weights for each layer) and (2) generate calculations and translate them into a new map incorporating these changes that can be displayed in a web application. Using the ArcGIS Javascript API we call the Geoprocessing service through a Geoprocessor object. By setting the basket weights as model parameters when a user adjusts the basket weights and clicks submit, the raster calculator is triggered and a user-defined map is returned in the browser (Figure 3 below).
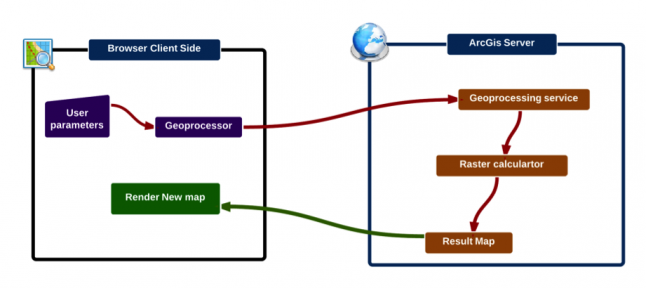
Figure 3. Client-side and server-side work flow process to create a user-defined vulnerability map. For example, the first map below (Figure 4) shows the vulnerability model with the CCAPS default weightings (25 Climate Hazard, 25 Population, 25 Household Resilience, 25 Governance), while the second map (Figure 5) displays the model with the revised weightings (40 Climate Hazard, 15 Population, 30 Household Resilience, and 15 Governance). As a result of these weighting changes, North Africa, Zambia and Zimbabwe are less vulnerable, most likely due to the reduced weighting of the governance variable.
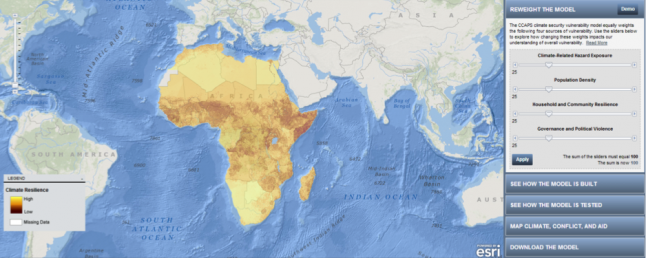
Figure 4. Vulnerability map from the new CCAPS dashboard using default variable weights.
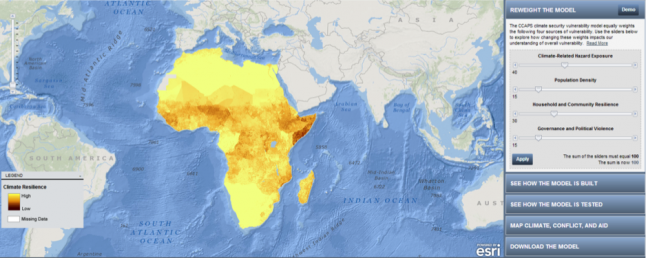
Figure 5. Vulnerability map from the new CCAPS dashboard using revised (user-adjusted) variable weights. Try your hand at using the interactive weighting, and let us know how your models compare with ours!