Inside Nepal's Ministry of Finance, a small four-person team has a formidable responsibility: overseeing more than a $1 billion in development assistance annually that represents up to 20% of the national budget.
Accelerating the country’s development and improving the livelihoods of the 25% of Nepalis who live below the poverty line requires maximizing the impact of every dollar spent. To that end, the Development Partnership Management Unit (DPMU) team collects and curates a wealth of data on aid flows from numerous sources.
Yet without the tools and training to effectively manage and distill insights from this data, the sheer magnitude of information can quickly become a hinderance rather than a boon. In 2013, the AidData Center for Development Policy partnered with the DPMU to enable them to more effectively harness aid information for better decision-making.

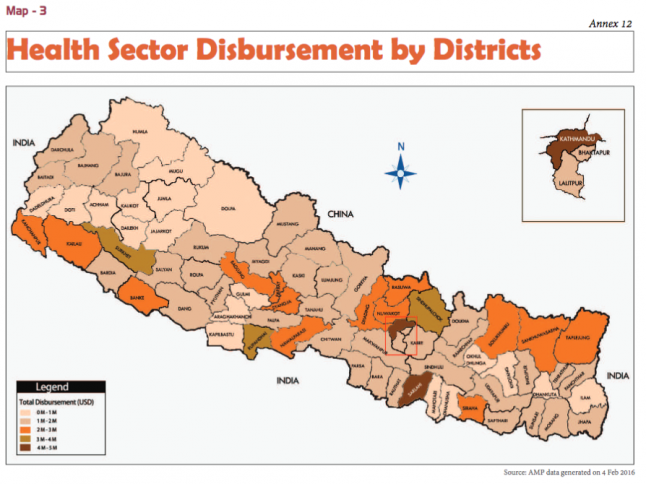
With support from USAID under its Higher Education Solutions Network program, we worked with the DPMU to geocode the universe of aid projects in Nepal. For the first time, the government was able to track aid dollars down to the precise locations where services were delivered and easily visualize its entire aid portfolio on a map.
Following the launch of the government's public aid portal in June 2013, Mr. Tilak Bhandari, Senior Project Officer of Nepal’s Ministry of Finance, captured the significance of this step. “[Before], we had nothing…now we have all aid information at our fingertips.”
Institutionalizing data-driven decisions

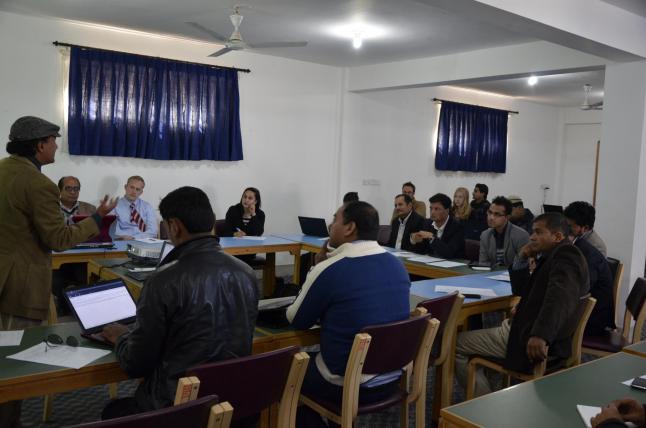
Together with USAID/Nepal’s GIS Specialist, we worked on building the capacity of DPMU staff to analyze geocoded data. Our training efforts focused on institutionalizing the use of geocoded data in a flagship report produced by the DPMU, the Development Cooperation Report.
This annual report dissects vital trends in Nepal’s development assistance: how much aid, what kind, how it gets allocated, and where it goes. The report’s big-picture framework informs discussions between the government and development partners about what to fund and how.
After two years of intensive engagement, DPMU now independently conducts the geospatial analysis to produce the Development Cooperation Report without external support, and uses the geocoded data to illustrate aid trends and make recommendations for the coming year.
Toward better development policy
The investment in incorporating geocoded aid information for government planning quickly paid off. When aid patterns were visualized in a series of maps for the 2014 report, the Ministry of Finance was able to identify a stark pattern in the allocation of resources.

Many development partners were focusing in the same geographic areas and sectors, while assistance to the poorest Far Western region was trailing behind other areas. “We didn’t know about [aid] fragmentation before, but now we have evidence,” said Bhandari.
This analysis of the situation directly informed the government’s updated Development Cooperation Policy, launched in 2014 to give structure and direction for development investments in Nepal.
The new policy calls on donors to allocate funds to rectify the regional imbalances in development assistance, as well as to more effectively coordinate activities to reduce the aid fragmentation the geocoded aid information helped identify.
Government officials note that access to geocoded data has empowered them to more effectively negotiate with development partners to ensure that external assistance advances Nepal’s development interests. The former chief of the Ministry of Finance’s aid coordination division observed, “there is a broad and active community within Nepal…that is eager to learn more about the aid scenario. We are confident that this [aid] openness will not only strengthen accountability in the foreign aid mobilization, but will also provide opportunities to make aid more effective.”


