A few weeks ago, AidData’s partners at the Strauss Center’s Climate Change and African Political Stability (CCAPS) program launched its Conflict Dashboard. This is the latest in CCAPS’ map dashboard series which allow users to visualize datasets from many sources together on a map, covering topics from poverty, population density, and CCAPS’ climate vulnerability model to geocoded aid activities and conflict events. These three dashboards (the CCAPS Dashboard and CCAPS Aid Dashboard were both launched last year) were each created leveraging Esri technology.
The CCAPS conflict dashboard combines the Social Conflict in Africa Dataset (SCAD) and the Armed Conflict Location and Event Dataset (ACLED). SCAD includes a wide range of events, from riots, protests, and strikes, through government violence against civilians, between 1990-2011, while ACLED focuses more on traditional conflict events and tracks real-time conflict events, which are updated monthly (currently through January 31, 2013). So come back each month to see where the latest conflict in Africa is taking place.
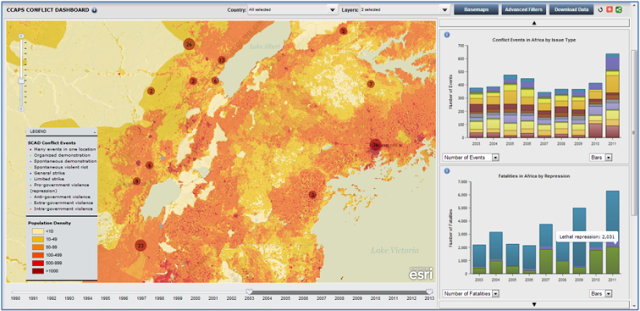
With this dashboard, users can see broad trends such as the most common types of conflict events, the use of government repression, or the proliferation of different types of actors over time through charts on the right-hand side of the map. At the same time, users can overlay actual conflict events with geographic ethnic power relations, national GDP levels, or local population density levels. All conflict data are filterable by time, type of event, actor name, and many other criteria, creating a highly interactive and customizable user experience for researchers and policymakers. After filtering and customizing their dashboards, users can share their results through Twitter, Facebook, Email, or other outlets or can embed their maps in their own blogs or websites. Visit ccaps.aiddata.org/conflict to see what you can learn.